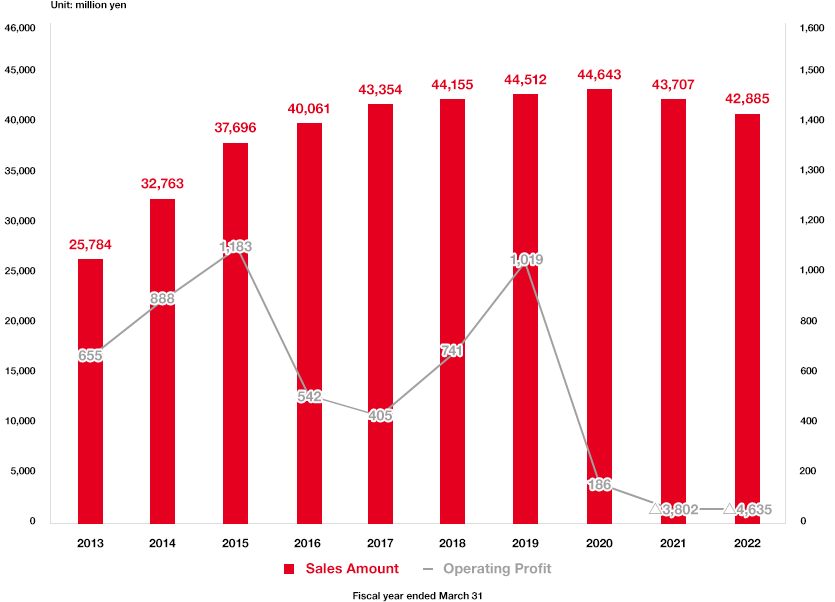
Business Performance
About Us
About Us
| Unit:million yen | Assets | Liabilities and net assets | |||||
|---|---|---|---|---|---|---|---|
| 2020 3M |
2021 3M |
2022 3M |
2020 3M |
2021 3M |
2022 3M |
||
| Current assets | 11,873 | 14,542 | 17,885 | Current liabilities | 7,891 | 7,009 | 8,576 |
| Cash and deposits | 8,877 | 9,431 | 12,834 | Accounts payable - trade | 1,503 | 1,443 | 1,659 |
| Accounts receivable - trade | 1,191 | 1,419 | 1,724 | Current portion of long-term loans payable | 771 | 1,018 | 913 |
| Merchandise | 45 | 45 | 63 | Others | 5,616 | 4,548 | 6,004 |
| Raw materials and supplies | 949 | 955 | 807 | Non-current liabilities | 12,227 | 14,002 | 12,526 |
| Other | 809 | 2,690 | 2,435 | Bonds payable | 7,050 | 6,035 | 5,100 |
| Non-current assets | 21,056 | 16,275 | 17,468 | Long-term loans payable | 1,847 | 4,923 | 4,010 |
| Property, plant and equipment | 11,121 | 8,217 | 9,080 | Other | 3,550 | 3,043 | 3,415 |
| Intangible assets | 2,881 | 1,279 | 1,235 | Total liabilities | 20,339 | 21,012 | 21,102 |
| Investments and other assets | 7,053 | 6,778 | 7,151 | Net assets | 12,802 | 9,990 | 14,390 |
| Shareholders' equity | 13,481 | 10,500 | 14,791 | ||||
| Deferred assets | 210 | 184 | 158 | Accumulated other comprehensive income | -833 | -722 | -683 |
| Non-controlling interests | 154 | 198 | 279 | ||||
| Total assets | 33,141 | 31,002 | 35,492 | Total liabilities and net assets | 33,141 | 31,002 | 35,492 |
| 2015 3M |
2016 3M |
2017 3M |
2018 3M |
2019 3M |
2020 3M |
2021 3M |
2022 3M |
|
| Capital to asset (%) | 42.5 | 51.8 | 45.1 | 45.8 | 48.3 | 38.2 | 31.5 | 39.7 |
| The same above on a market value (%) | 123.4 | 94.1 | 89.0 | 103.2 | 112.3 | 95.0 | 100.2 | 90.7 |
| Cash Flow to Interest-bearing debt (year) | 3.0 | 6.0 | 6.6 | 5.1 | 4.2 | 9.7 | - | 2.7 |
| Interest coverage ratio (Cash flow/interest paid out) |
17.7 | 9.1 | 12.7 | 15.5 | 19.3 | 12.4 | - | 36.6 |